Investing
20 Mar 2026
8 min read
Noor Kaur
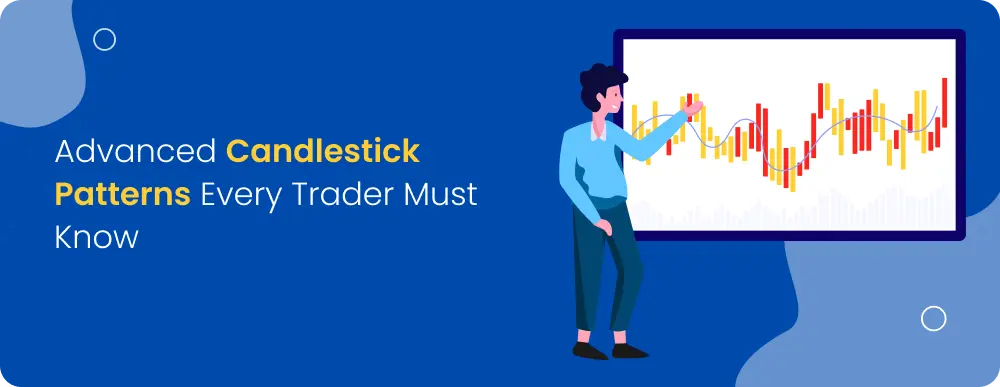
Advanced Candlestick Patterns Every Trader Must Know
Get AI powered quick summary
Key Takeaways:
This content explains advanced candlestick patterns, their types, and market psychology.
These patterns indicate the Open, High, Low and Close (OHLC) prices for an asset class over a specific timeframe.
They work across various asset classes.
Candlestick pattern strategies use pattern confirmation for intraday trading and higher timeframe reliability for swing trading.
Introduction:
Over the past few decades, electronic trading systems have made the equity market more feasible for trading. Earlier, there were open outcry systems or floor trading, a popular method used to communicate trade orders in trading pits via verbal and hand signal communication. Due to the severe disadvantages of the earlier system, the market shifted to electronic trading systems.
Nowadays, traders interpret market emotions through charts. The most popular charts are candlestick charts. They are very useful for:
Showing open, high, low and close prices of an asset class in a clear format.
Helping traders understand market psychology by revealing buying pressure, selling pressure and indecision.
Recognising candlestick patterns that indicate potential trend reversals or continuations.
Supporting better entry and exit timing for intraday and swing trading.
Meaning of Candlesticks :
Candlesticks are visual tools that represent price movement for an asset class over a specific time period. Each candlestick provides four critical prices points:-
1. Open Price (O)
The price at which an asset starts trading at the beginning of a specific time frame.
It forms either the base or the top edge of the candlestick body.
2. High Price (H)
It indicates the maximum buying pressure or resistance levels during the period.
It is marked by the top of the upper wick/shadow.
3. Low Price (L)
It indicates the maximum selling pressure or support levels during that period.
It is marked by the bottom of the lower wick/shadow.
4. Close Price (C)
It shows the final traded price at the end of the time period.
It forms the top of the body for a bullish candle and the bottom of the body for a bearish candle.
This makes it one of the most informative and widely used charting tools in technical analysis.
Candlesticks Patterns & Market Psychology:
Market psychology is reflected through candlesticks as follows:
1. FEAR
Long bearish candles and sharp price declines indicate fear-driven selling.
This is often seen during market uncertainty or negative news.
2. GREED
Strong bullish candles with large bodies show aggressive buying and optimism, as traders rush to participate in rising prices.
3. INDECISION
Small-bodied candles signal a balance between buyers and sellers, showing uncertainty about price direction.
4. PANIC
Extended wicks and high volatility candles highlight emotional, rushed decisions, where prices move rapidly before stabilising.
Types of Candlestick Patterns:
There is no single pattern, as they may fail in range bound or highly volatile conditions, and patterns must be selected based on the trend, volatility, and, price location.
1. Japanese candlestick patterns
These patterns are rooted in market psychology and not in the market prediction.
Their effectiveness depends on trend, price location, volume and confirmation.
2. Bullish candlestick patterns
They signal potential upward price movement
Key examples are:
3. Bullish Engulfing Pattern –
It shows a shift from selling pressure to strong buying interest.
The psychology behind it states that sellers lose control as buyers step in aggressively.
For instance, after a downtrend, a large green candle fully engulfs the previous red candle.
4. Morning Star Pattern –
It shows the possible reversal from a bearish to a bullish trend.
The psychology behind it states that the weakening of selling pressure leads to indecision, where buyers regain confidence.
For instance, a long red candle, followed by a small-bodied candle, then a strong green candle.
5. Bearish candlestick patterns
It signals potential downward price movement.
6. Bearish Engulfing Pattern -
It shows strong selling pressure that overtake buyers.
When sellers dominate the market, buyers lose confidence.
For instance, after an uptrend, a large red candle engulfs the previous green candle.
7. Evening Star Pattern –
It shows the possible end of an uptrend.
Strong selling occurs when momentum fades, while buying and hesitation coexist.
For instance, a strong green candle, a small indecision candle and a long red candle.
8. Reversal candlestick patterns
8.1. Hammer/ Hanging Man –
It shows the rejection of lower price levels.
The psychology behind it states that the sellers push prices down, but buyers recover strongly.
For example, a small body with a long lower wick near the support.
Don’t ignore the trend context like a hammer in an uptrend vs a downtrend.
8.2. Tweezer Top/ Tweezer Bottom –
It shows that the price struggles to move beyond a key level.
Market participants react similarly at the same price level.
For instance, two consecutive handles with equal highs or lows.
9. Continuation candlestick patterns
It suggests trend continuation after a temporary pause.
9.1. Rising Three Method –
It shows temporary consolidation within an uptrend.
For instance, one strong green candle, three small red candles, followed by another strong green candle.
9.2. Falling Three Method –
It shows continuation of a downtrend.
For instance, one strong red candle, three small corrective candles, followed by another strong red candle.
Role of Candlestick Patterns: Intraday & Swing Trading:
Candlestick patterns serve different purposes based on the trader’s time horizons, market conditions and confirmation approach. Let’s understand from the following:
INTRADAY TRADING
Intraday traders use candlestick patterns on lower timeframes, such as 5, 10, 15 and 30 minutes chart, to capture short term price movements.
These patterns help traders to identify real time shifts in buying and selling pressure.
Intraday candlestick patterns include bullish and bearish engulfing patterns, doji formations and hammer type candles.
They are most reliable when aligned with key intraday levels such as VWAP, opening range, and the previous day’s highs and lows.
Volume confirmation is critical in intraday trading for genuine participation.
SWING TRADING
Swing traders use candlestick patterns on higher timeframes, such as daily and weekly charts, to reduce market noise.
These patterns help traders to identify trend reversals and continuations.
Patterns such as morning star, evening star, and three method formations are used for swing trading.
Swing trading candlestick patterns are reliable when they appear near major support and resistance zones, trendlines or moving averages.
FAQs:
1. What is the candlestick pattern strategy?
A candlestick pattern strategy aims to evaluate the past behaviour of the asset prices and identify recurring candlestick patterns.
2. Why are candlestick features important in technical analysis?
Traders need to know about the features of candlesticks to visualise market sentiment, analyse supply and demand, as well as predict potential price reversals or continuations.
3. What does the body of a candlestick indicate?
The rectangular part of the body shows the difference between the open and close prices.
4. How does candle colour help traders?
Candle colour gives a quick insight into market direction, whether bullish or bearish. A green or white body indicates the closing price is higher than the open (bullish). A red or black body indicates the closing price is lower than the open (bearish).
5. How do candlestick patterns help predict reversals or continuations?
Candlestick patterns help predict reversals or continuations through momentum shifts in body size, colour and wicks. Reversal patterns appear at the end of the trend, and continuation patterns show consolidation in the prevailing trend.
6. Are candlestick patterns enough for trading decisions?
No, candlestick patterns are more reliable when combined with trend analysis, volume and price levels.
Share on:


RelatedBlogs
11 Aug 2023
Investing
Interest Rates: Explore definitions, types and factors influencing rate
Time and money have a strong relationship. The cost of goods and services, for example, tends to rise over time.

11 Aug 2023
Investing
Intraday Trading Strategy: Open High Open Low Approach
Intraday trading is one of the most exciting and rewarding types of online stock trading. As a day trader, you sho...
2 Apr 2024
Investing
Understanding Optimal 5-Year Investment Strategies in India | mastertrust
Reaching your financial objectives requires careful planning of your investments. In India, where the stock market...
2 Apr 2024
Investing
Explore Top Drone Stocks for Indian Investors | mastertrust
In India, the use of drones has increased considerably in recent years. According to a KPMG analysis, 49 big deals.
Subscribe for Newsletter
Share on:
Open a Free Demat Account with us only in few minutes
By processing, you agree terms & conditions.

Commonly Asked Questions
It is simple and paperless. Visit our website, enter your mobile number, and complete the e-KYC process to open a demat account instantly. Our digital onboarding ensures you can start investing in minutes without physical paperwork.
We unify speed, stability, and advanced tools in one place. Unlike basic apps, our ecosystem offers deep analytics, algo capabilities, and expert support, making us the preferred platform for trading for both beginners and professionals.
A demat account acts like digital storage for your shares and securities, while a trading account is the interface used to buy and sell them. At mastertrust, you get both linked seamlessly for a smooth investment experience.
With over 41+ years of market presence, we combine trust with modern technology. Our transparent pricing, personalised guidance, and regulatory compliance make us one of the preferred stock brokers in India for secure wealth creation.
