Investing
18 Feb 2025
7 min read
Noor Kaur
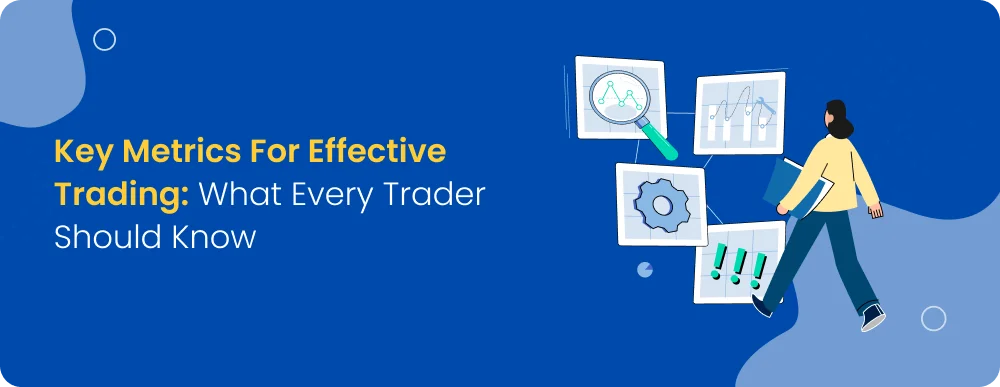
Key Metrics for Effective Trading: What Every Trader Should Know
Get AI powered quick summary
Tracking the right metrics helps you refine your trading strategy and make informed decisions. Whether you're a beginner or an experienced trader, focusing on key data points like trading indicators, risk-reward ratios, and stock signals can improve your performance. Understanding these metrics allows you to adjust your approach, minimise losses, and develop the best trading strategy for your goals.
Key Metrics for Effective Trading: What Every Trader Should Know
Tracking the right metrics is essential for improving your trading strategy and making informed decisions. Whether analysing trading indicators or refining your stock signals, understanding key metrics helps you minimise risk and maximise profitability.
Understanding Key Trading Metrics
Each metric plays a specific role in shaping your best trading strategy. For example, a high win rate means little if your losses outweigh your gains, while a strong risk-reward ratio can offset a lower win rate. Therefore, having a good grasp of these metrics allows you to fine-tune your trading signals and improve overall performance.
Win Rate and Its Significance
Your win rate tells you how often your trades end in profit. It’s calculated using the formula:
Win Rate (%) = (Number of Winning Trades / Total Trades) × 100
For example, if you make 100 trades and 60 are profitable, your win rate is 60%. A high win rate is good, but it doesn’t guarantee profitability. If your average loss per trade is higher than your average profit, you could still lose. That’s why pairing the win rate with the risk-reward ratio gives a more accurate picture of your trading strategy.
Risk-Reward Ratio: Balancing Risk and Return
The risk-reward ratio (RR) measures how much profit you expect to make for every rupee you risk. It’s calculated as:
RR = Potential Profit / Potential Loss
For example, if you risk ₹500 on a trade with a potential profit of ₹1,500, your RR is 3:1. This means even if your win rate is only 40%, you could still be profitable because your wins outweigh your losses. A good trading strategy aims for a strong RR to balance occasional losses and improve long-term performance.
Expected Value (EV) and Profitability
Expected Value (EV) helps you estimate whether your trading approach is profitable. It considers both the win rate and the size of wins and losses. The formula is:
EV = (Win Rate × Average Profit) – (Loss Rate × Average Loss)
For example, if your win rate is 50%, your average profit per trade is ₹2,000, and your average loss per trade is ₹1,000, your EV would be:
(0.50 × 2,000) – (0.50 × 1,000) = 1,000 – 500 = ₹500
A positive EV means your trading strategy will likely be profitable over time. A negative EV suggests you need adjustments, such as refining trading signals or improving risk management.
Total P&L and Return on Investment (ROI)
Your Total P&L (Profit and Loss) is the difference between your total profits and losses:
Total P&L = Total Profits – Total Losses
For example, if you’ve made ₹1,00,000 in profits but lost ₹40,000, your total P&L is ₹60,000. This helps you see if your trading strategy is working over time.
Return on Investment (ROI) measures how efficiently you use your capital. The formula is:
ROI (%) = (Net Profit / Total Investment) × 100
For example, if you invested ₹5,00,000 and earned ₹1,00,000 in profit, your ROI is:
(1,00,000 / 5,00,000) × 100 = 20%
A higher ROI means you’re using your funds effectively. Tracking ROI regularly with a trading tracker helps you compare different strategies and improve efficiency.
Risk Management: Protecting Your Capital
One key risk metric is risk percentage, which measures how much of your capital you will lose per trade.
Risk Percentage = (Amount at Risk / Total Trading Capital) × 100
For example, if you have ₹10,00,000 in capital and risk ₹20,000 per trade, your risk percentage is 2%. Keeping this low—typically under 2% per trade—helps protect your funds from major losses.
Tracking Metrics for Better Trading Decisions
Instead of relying on emotions, maintaining a trading tracker helps you analyse historical data and adjust your approach based on real performance. By consistently reviewing these metrics, you can:
- Identify strengths and weaknesses in your trading strategy
- Optimise your trading signals for better accuracy
- Improve risk management and capital allocation
- Increase your chances of long-term profitability
Also, using a trading guide and monitoring trading indicators allows you to refine your approach and make better trading decisions.
How Mastertrust Helps Traders Optimise Performance
Mastertrust offers a comprehensive trading platform designed to improve efficiency and decision-making. Here’s how it helps traders maximise their performance:
- Comprehensive Algo Trading: Automate trades with precision and remove emotional bias.
- Backtest Your Strategies: Test strategies using historical data to refine performance.
- Lightning-Fast Trading Portal: Execute trades with low latency for better efficiency.
- Advanced TradingView Charts: Access 100+ built-in indicators and powerful screeners for deeper market insights.
- Free API Integration: Customise trading strategies with 100% flexibility and seamless API access.
- Multi-Language Support: Trade comfortably in your preferred language.
Conclusion
A strong trading tracker gives insights into your performance, helping you identify patterns and adjust your approach. By consistently analysing trading signals and key metrics, you can fine-tune your trading strategy and stay ahead in the market. Use a reliable trading guide or Trading App to track your progress and make data-backed decisions for better results.
FAQ
How does the risk-reward ratio impact trading success?
A good risk-reward ratio helps traders limit potential losses while maximizing profits, making it one of the most critical metrics in trading.
Why is tracking drawdown important in trading?
Drawdown shows the peak-to-trough decline in a trading account. Monitoring it helps traders manage risks and avoid significant capital losses.
What role does position sizing play in effective trading?
Position sizing determines how much capital to allocate per trade, balancing risk and potential returns to protect overall portfolio health.
Share on:
RelatedBlogs

11 Aug 2023
Investing
Read MoreInterest Rates: Explore definitions, types and factors influencing rate
Time and money have a strong relationship. The cost of goods and services, for example, tends to rise over time.

11 Aug 2023
Investing
Read MoreIntraday Trading Strategy: Open High Open Low Approach
Intraday trading is one of the most exciting and rewarding types of online stock trading. As a day trader, you sho...
2 Apr 2024
Investing
Read MoreUnderstanding Optimal 5-Year Investment Strategies in India | mastertrust
Reaching your financial objectives requires careful planning of your investments. In India, where the stock market...

2 Apr 2024
Investing
Read MoreExplore Top Drone Stocks for Indian Investors | mastertrust
In India, the use of drones has increased considerably in recent years. According to a KPMG analysis, 49 big deals.
Subscribe for Newsletter
Share on:
Open a Free Demat Account with us only in few minutes
By processing, you agree terms & conditions.


Open a Demat Account in 5 minutes !
Step 01
Click on the button below to open your new account.
Step 02
Fill out some basic details to get started.
Step 03
Upload your documents to verify your account.
Step 04
Start trading within just 24 hours of registration.
Commonly Asked Questions
It is simple and paperless. Visit our website, enter your mobile number, and complete the e-KYC process to open a demat account instantly. Our digital onboarding ensures you can start investing in minutes without physical paperwork.
We unify speed, stability, and advanced tools in one place. Unlike basic apps, our ecosystem offers deep analytics, algo capabilities, and expert support, making us the preferred platform for trading for both beginners and professionals.
A demat account acts like digital storage for your shares and securities, while a trading account is the interface used to buy and sell them. At mastertrust, you get both linked seamlessly for a smooth investment experience.
With over 41+ years of market presence, we combine trust with modern technology. Our transparent pricing, personalised guidance, and regulatory compliance make us one of the preferred stock brokers in India for secure wealth creation.

Slide 1 of 1