Technical analysis is studying the historical data to determine the future movement of the stock market. Unlike fundamental analysis, technical analysis does not consider the value of the stock but is limited to its price movements.
Three tenets of technical analysis
- Market actions discount everything, which means any information about the stock is reflected in its price and any new information is also immediately seen in the price movement
- The stock prices move in certain observable trends until the trend line is broken and it is recommended you trade with the established trend
- Historical charts have been used for over 100 years and are relevant even today because price movements are known to be repetitive
What are charts?
A chart is the visual representation of the stock price over a certain period. The Y-axis and X-axis represent the price and time, respectively. The price movements are charted from left to right on the X-axis. Technical analysis uses different types of charts as listed below:
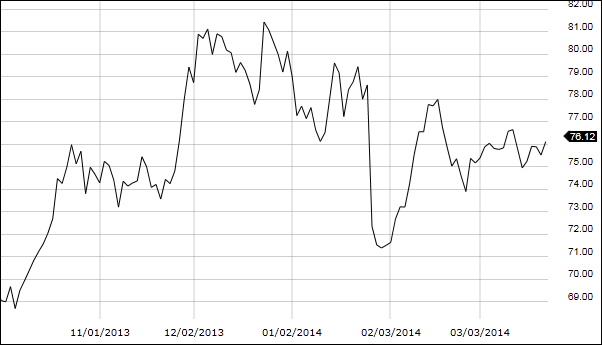
- Line chart represents the bigger picture of price movements. It is plotted by connecting closing stock prices over a period. Some stock trading professionals consider closing price more important than high, low, and opening price.
- Bar charts are one of the most popular types and represent the day’s opening, high, low, and closing prices of a particular stock. This provides a detailed overview of the volatility of the stock during the day.
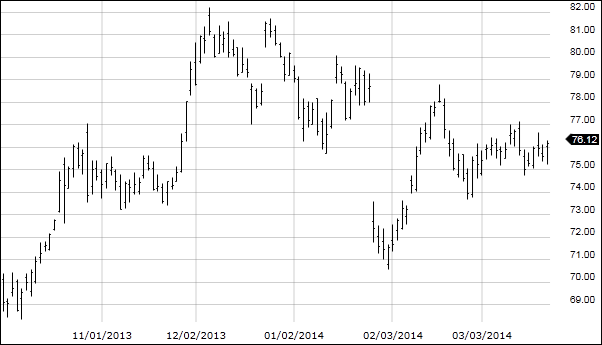
In the above image, the opening and closing prices are represented by the ticks on left and ride side, respectively. The bottom and the top of the vertical bar depict the lowest and highest prices of the stock for the particular period.
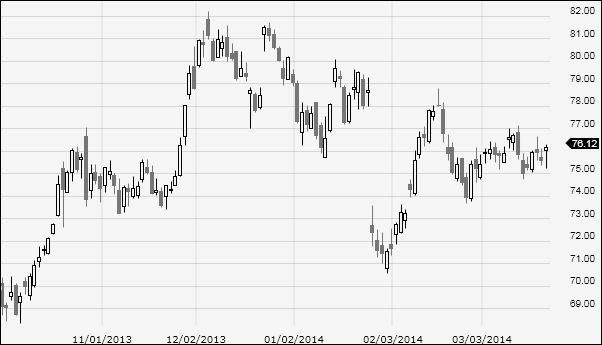
- Candlestick charts are similar to the open-high-low-close (OHLC) chart and present the data for a particular day in an easy and quicker format. The body of the candle in the following figure shows the movement between the opening and closing prices.
Trends
One of the most critical components of technical analysis is trend. It is the direction of price movements based on the past. Trends comprise troughs and peaks. Whether these troughs and peaks move upwards, downwards, or sideways indicate the direction of the trend.
- An upward trend comprises rising peaks and troughs with higher lows and highs
- Downward trends comprise declining peaks and troughs with lower highs and lows
- Consolidation with sideways price movements in a horizontal range occurs during sideways trends
- Primary depicting long-term movements (one year or more)
- Secondary length is intermediate (one to three months)
- Minor is short-term length (less than one month)
Trend lengths are categorized as
Trends are affected by the next longer and shorter lengths. A rising long-term trend results in smaller retracements and larger rallies in the intermediate length. On the other hand, short-term trend results in the intermediate length to ebb and flow. A declining long-term trend results in the intermediate trend to have larger retracements and smaller rallies. On the contrary, short-term length results in the ebb and flow of the intermediate trend.
Trend lines
Analysts often draw trend lines to determine the trend. It is a straight line connecting two or more price points extending into the future acting as a line of resistance or support.
· Uptrend line
An uptrend line is straight and drawn upwards to the right and connects two or more low points. The second point must be higher than the first point for the trend line to move upwards. These lines provide support indicating higher demand in comparison to supply even as the price movement is rising.
· Downtrend line
Downtrend line connects two or more high points towards the right. For the line to depict a decline, the second high must be lower than the first high. During price declines, downtrend lines indicate higher supply and acts as a resistance.
When trend lines break, it indicates a possible change in the trend. However, your investment decision should be based on using other tools and signals to confirm this trend.
Support and resistance
Support and resistance are important where demand and supply meet. Any breaks in these levels indicate movement in the demand and supply forces.
- Support is the level wherein the demand is strong to prevent further decline in the stock price. This is because, at this price, buyers are more willing to buy whereas sellers are unwilling to sell.
- Resistance is the level at which an increase in price is prevented. The reason is that as price increases, sellers are more willing to sell and buyers are unwilling to buy.
Technical analysis is one way to determine the future stock market and price movements. However, it is not an exact science and is subject to individual interpretation. Investors may combine fundamental and technical analysis along with trading software to make accurate decisions.